
Stretch Goal Reports
Glossary Words from the following Reports: Export, Import
Report: Value of Exports

Report: Firms Participating in Foreign Export Trade
Summary Report
Importance
- The New Brunswick economy is built around exports and the further opportunities they create
- Bringing in outside wealth (through positive trade balances) and increasing exporting within NB will:
- Create opportunities for non-exporting industries
- Stimulate a sustainable New Brunswick economy
- To track this, BoostNB has set goals relating to Value of Exports and for the Firms Participating in Export in the province
Problem
- New Brunswick has consistently had a negative trade balance
- New Brunswick’s trade deficit has hovered around $6 billion (Current Prices) over the last 10 years
- i.e., more money is leaving the New Brunswick economy through trade than entering which can cause the economy to faulter
Cause
- The New Brunswick trade deficit can be attributed to multiple factors
- Reduced and fading demand for the industries the New Brunswick economy was originally built around reliant on (lumber)
- New Brunswickers’ complacency with relying on federal equalization payments
- This resulted in New Brunswick passing up certain growth opportunities in the knowledge that the federal program would top them up
- Historical failure of the central government to develop the port region of Saint John, once one of the continents great harbours
- A failure to capture “linkages” of New Brunswick’s major exporting industries,
- Causing the province to import some of their major inputs from elsewhere rather than through a well-integrated New Brunswick economy.
In the Numbers
Figure 1 shows the growth of New Brunswick’s annual trade deficits over time. It also illustrates the shifting sources of the deficit. Through 2007, negative interprovincial trade balances made up the bulk of the total deficit, but since 2007 interprovincial deficits have shrunk while international deficits have increased dramatically. In order to attain balanced trade, New Brunswick will need to make larger strides in international markets.
Figure 1: New Brunswick Balance of Trade (x1,000,000, Current Prices)
Figure 2 shows imports and exports for the province which have increased and decreased simultaneously tending to always move in the same direction. However, despite following a similar pattern year over year, the gap between them has grown. Annual trade deficits are shown on the right axis.
Figure 2: New Brunswick Imports and Exports
This situation can be linked to the lack of progress in the number of Firms Participating in Foreign Trade which has not increased significantly in recent years as shown in Figure 3. New Brunswick will need to grow this number in order to reach balanced trade.
Figure 3: Numbers of Exporting Firms
To understand the strain that increased trade deficits might have on the economy it is useful to look at the trade deficits as a percentage of GDP. This is shown in Figure 3. In 2001 this hit a low of 6% but has now hovered around 17% for the last several years.
Figure 4: Trade Deficit as a Percentage of GDP
Summary
The New Brunswick economy is finding itself financing an increasingly burdensome trade deficit. This has come about through a massively increased international trade deficit. To sustain strong growth New Brunswick businesses will have to shrink this deficit. The settling of the trade deficit at around 17% of GDP since 2008 is an important area to improve in the New Brunswick economy.
Appendix
Appendix A: Balance of Trade
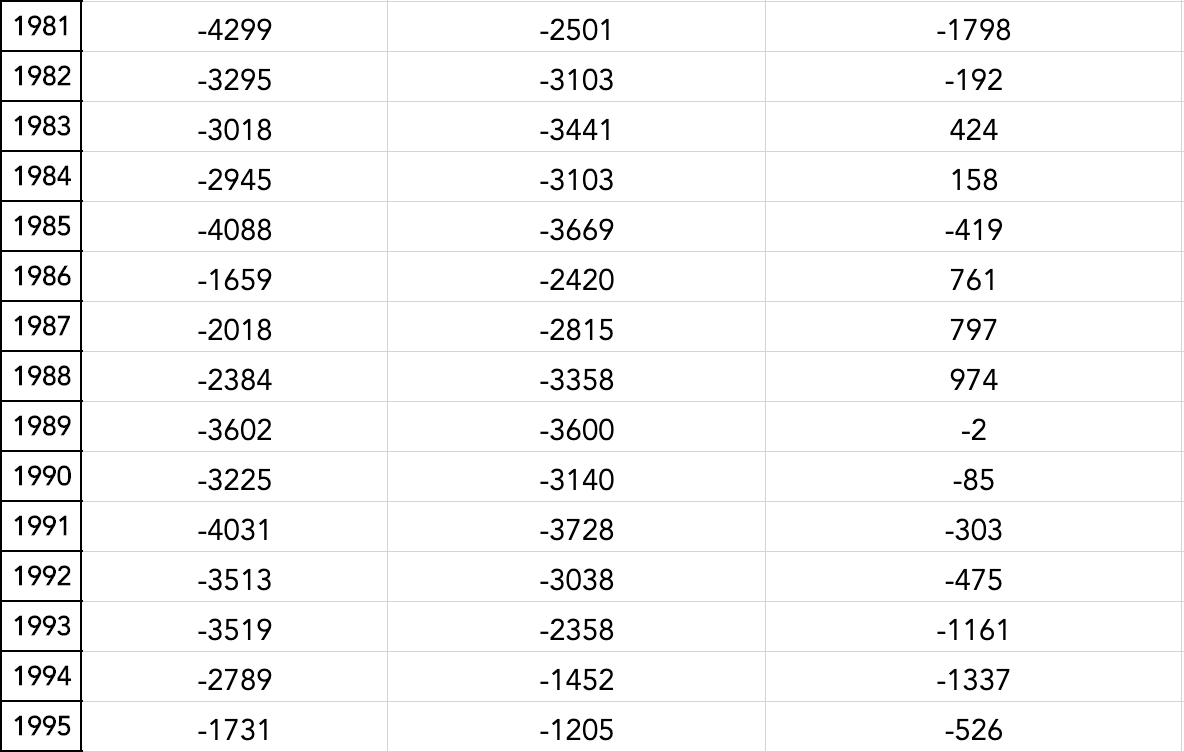
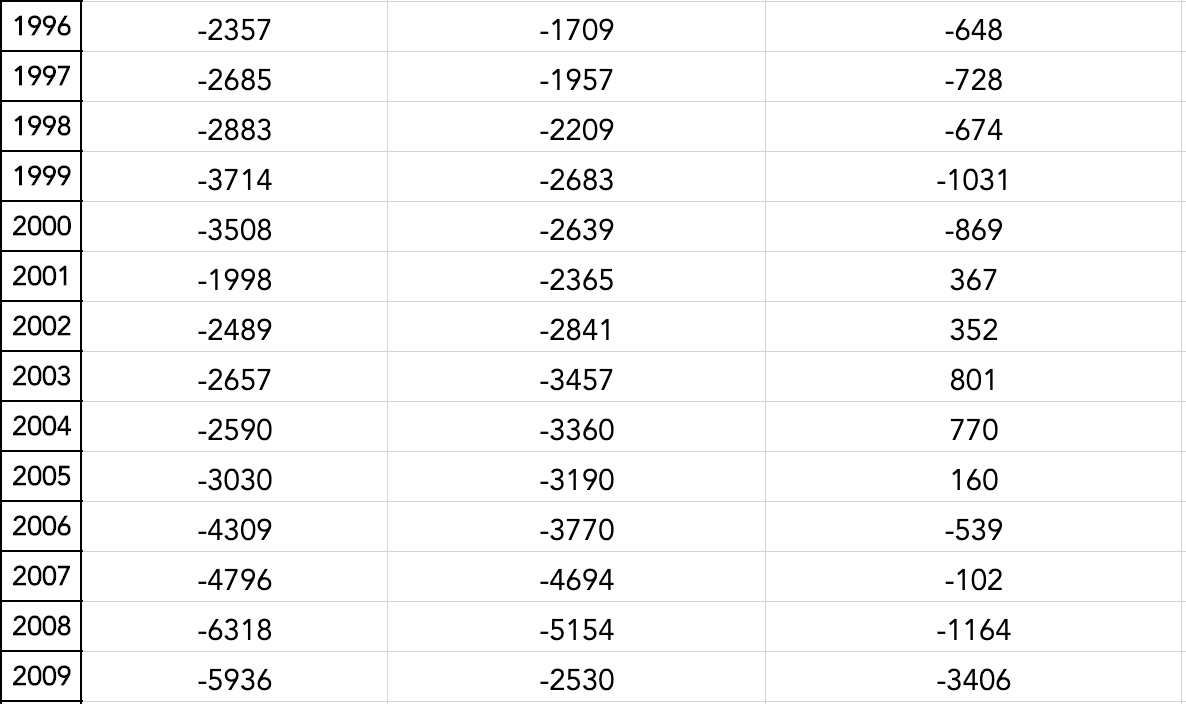
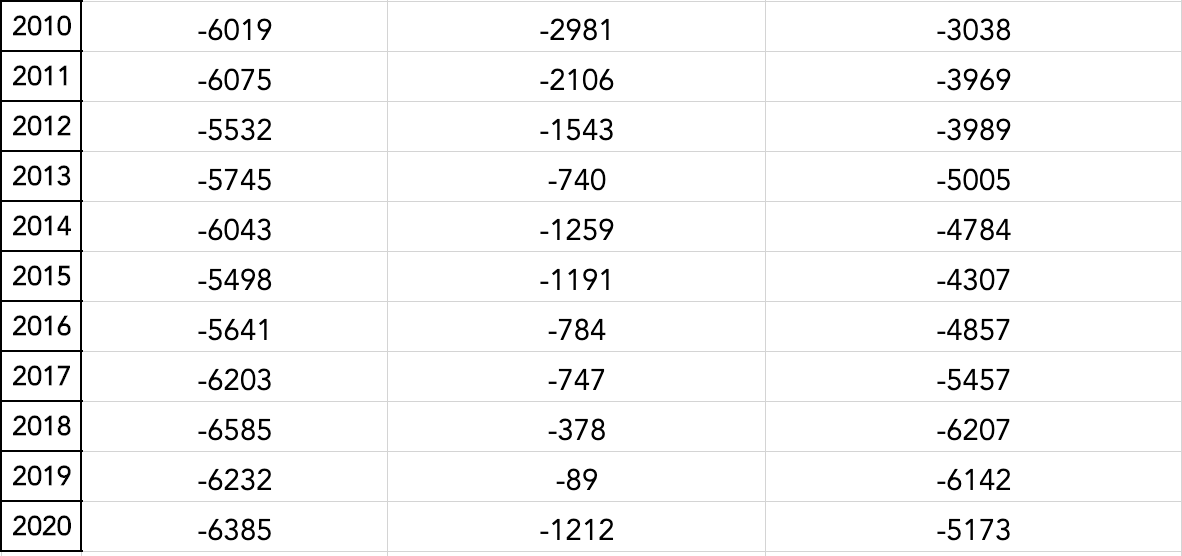
Source: Statistics Canada. Table 36-10-0222-01. Gross domestic product, expenditure-based, provincial and territorial, annual (x 1,000,000).
Appendix B: Trade Deficit as a Percentage of GDP
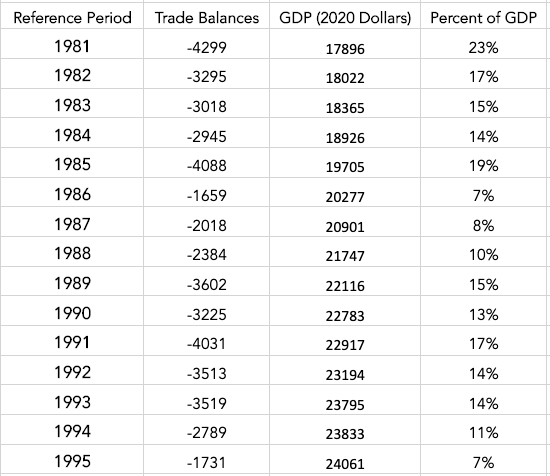
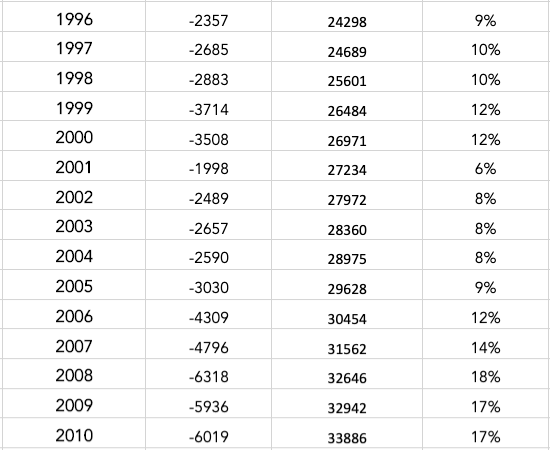
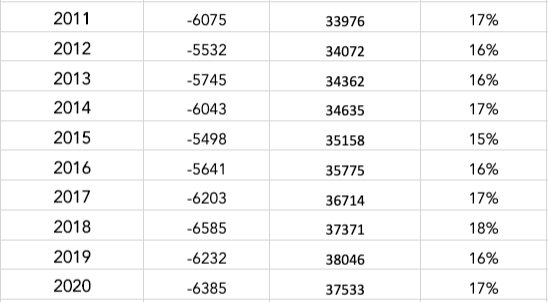
Source: Statistics Canada. Table 36-10-0222-01. Gross domestic product, expenditure-based, provincial and territorial, annual (x 1,000,000).