Stretch Goal Reports
Glossary Words from the following Reports: Employment, Labour Productivity, PSE Attainment Rate, CERB, CESB
Report: Labour Force Participation Rate

Report: Youth Employment

Report: Aboriginal and First Nations Employment Rates

Report: Post Secondary Education and Training

Report: Non-Government Employment
Summary Report
Importance
- Labour market indicators provide a useful proxy for signalling the health of the economy
- A healthy economy results in more, higher paying jobs
- Some BoostNB labour goals consist of:
- Labour Force Participation Rate
- Signals the attractiveness and quantity of existing available jobs
- Post Secondary Education & Training
- Labour market success means that employers will have a skilled and matched labour force to fill their employment requirements
- Non-Government Employment
- Indicates general health of the private sector
- Youth Unemployment
- Measure of young people in the province available and their working status
- Labour Force Participation Rate
- Success in each of these areas keeps wealth in the province
- NB is currently not on track in at least three of these areas
Problem
- New Brunswick youth leave to other provinces for better employment opportunities
- The outmigration of young workers makes NB less attractive to investing industries, creating a circular pattern of an aging population, fewer industries (making workers unproductive), and unproductive, poorly equipped workers in turn making the region less attractive
- The creation of good paying jobs could retain/gain young workers which could reverse this negative cycle
Cause
- NB has typically had high unemployment, particularly among its youth
- This has caused youth to seek employment elsewhere and New Brunswick not to be a preferred destination for immigration
- The aging nature of NB’s population results in an underperforming economy in a number of key Investment categories
- An aging workforce and low investment causes very low Labour Productivity
- This makes New Brunswick unattractive
- For all these reasons New Brunswick has typically performed poorly economically
In the Numbers
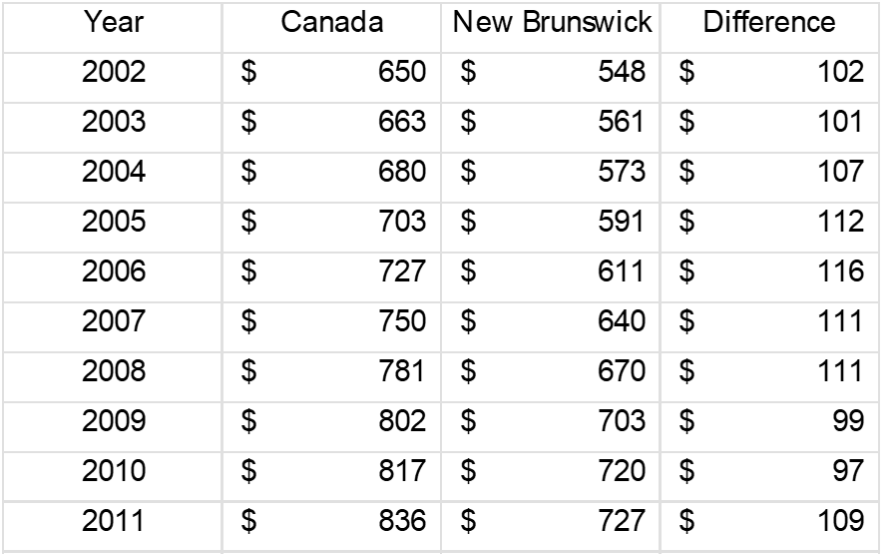
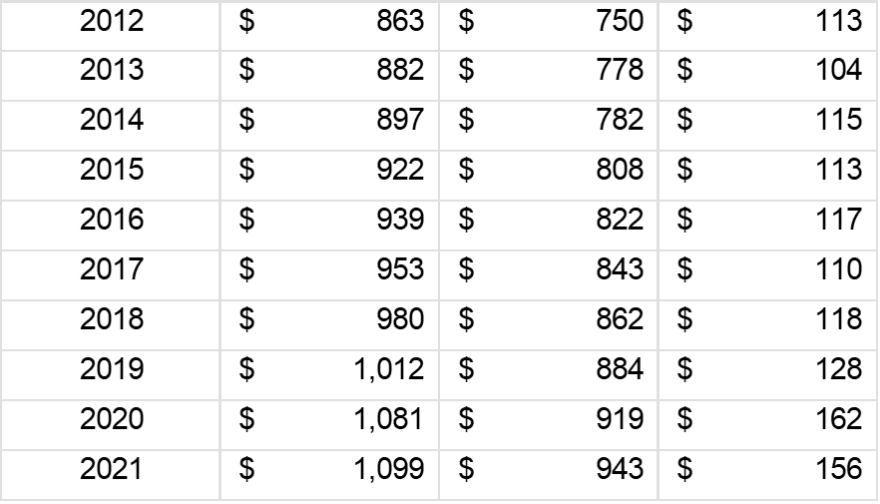
Figure 1 shows the growth of wages in current prices since 2002. The left axis shows the weekly average weekly wage rate, and the right axis shows the difference between the average Canadian and New Brunswick wage rate. This graph shows New Brunswick falling behind in wages, even as housing prices rise more quickly in New Brunswick. A healthy economy would close this gap, or at the very least not allow it to grow.
Figure 1: Average Weekly Income, All Industries (Current Dollars)
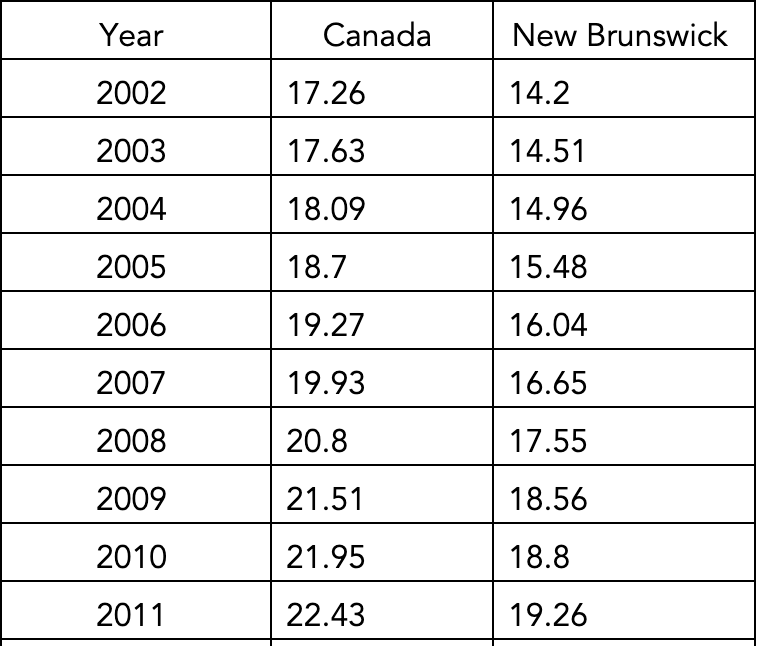
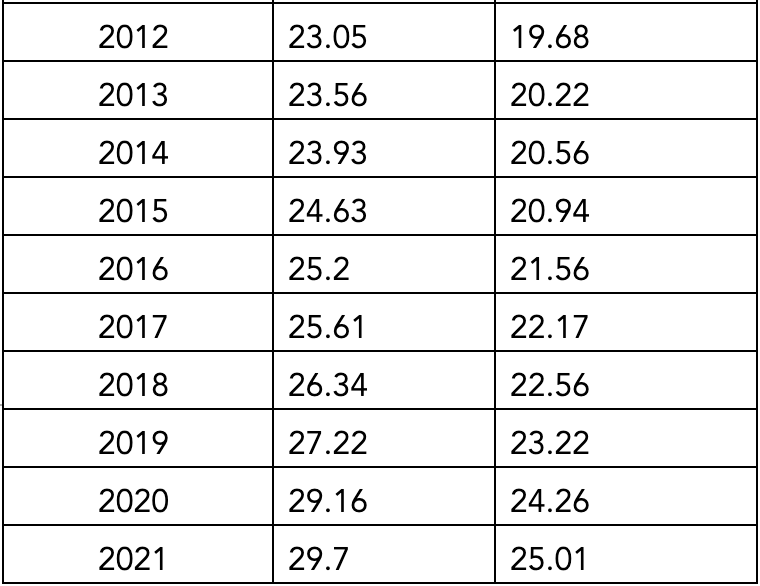
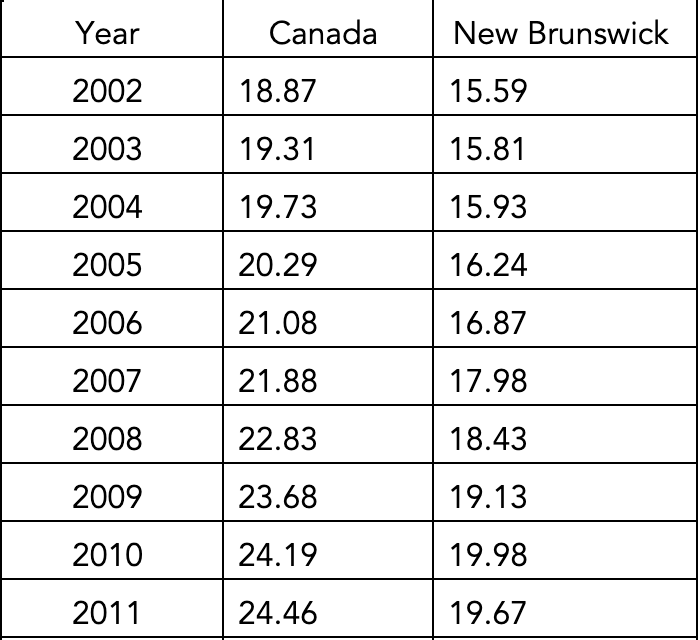
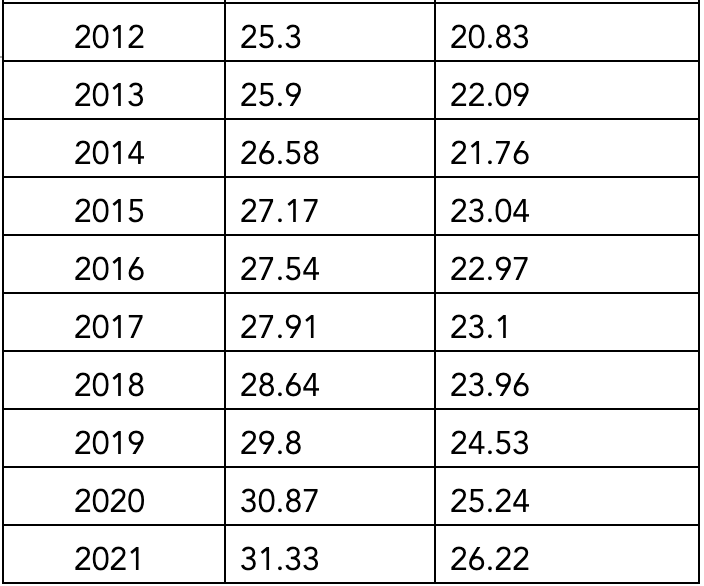
Some of the temporary fluctuations in weekly wages between New Brunswick and Canada may be due to a discrepancy in hours worked. Figure 2 below shows the gap between hourly wages in Canada and New Brunswick. It includes both full-time and part-time workers across all union statuses. In 2021, New Brunswick’s average hourly wage rate was almost $3.50 lower than the Canadian average. Although both have been rising, NB consistently lands lower. This may be a result of a lower minimum wage in the province or higher-paying industries leaving the province and being replaced with lower-paying jobs.
Figure 2: Average Hourly Wage Gap, All Industries (Current Dollars)
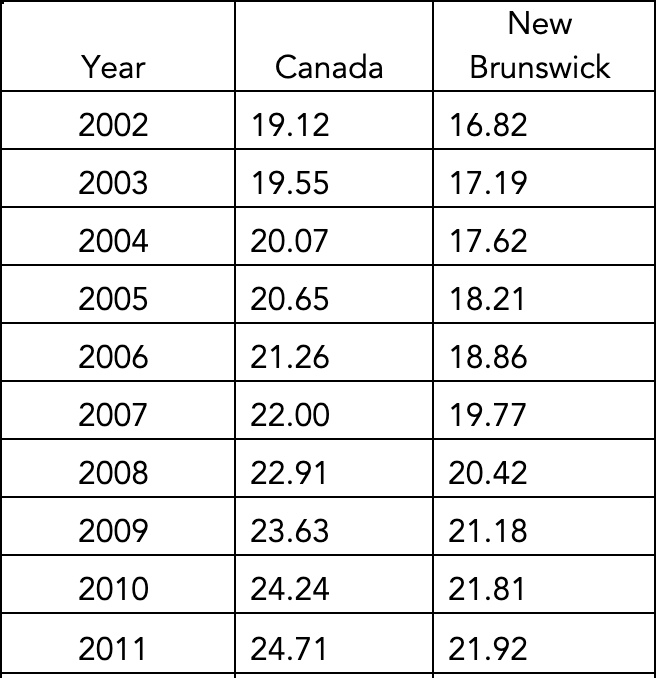
Labour can be classified into two broad industries. The goods-producing sector and the services-producing sector. The goods producing sector includes jobs and businesses that produce tangible goods These would be things such as manufacturing and agriculture. The second broad labour industry is the service-producing industry which considers jobs and businesses that do not produce tangible goods – things like educational services, health care, and professional and business services. For both goods industries and service industries, NB experiences lower average hourly wages compared to the Canadian average. This can be seen in Figure 3 and 4. Within the goods market, the fluctuation is likely a function of exogenously determined goods prices. The fluctuation of hourly wages for workers employed by goods industries is shown in Figure 3.
Figure 3: Average Hourly Income, Goods Industries (Current Dollars)
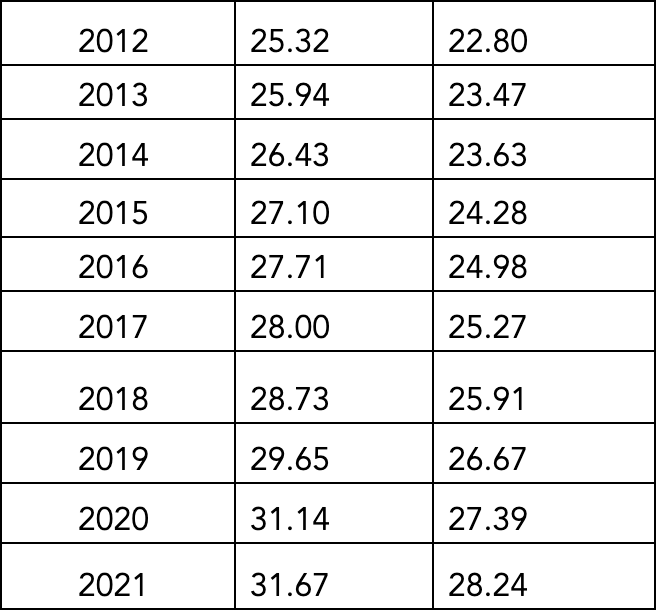
Although most fluctuation originated in the wages for employees in goods industries, the most recent bump in average hourly wages in Canada has originated in service industries. This is shown in figure 4. This could be due to various factors including implications of the Covid-19 pandemic and increased demand for service industries such as health care.
Figure 4: Average Hourly Income, Service Industries (Current Dollars)
Summary
To correct for low wages and low per capita GDP, New Brunswick will need to improve in the BoostNB Labour Goals. New Brunswick will need to ensure it is training the types of workers that the economy relies on, has structures that encourages people to seek employment, and is able to retain its young people through competitive wages and job offerings.
Appendix
Appendix A: Average Weekly Wages All Industries (Current Dollars)
Appendix B: Average Hourly Wage Gap, All Industries (Current Dollars)
Appendix C: Average Hourly Wages, Goods Industries (Current Dollars)
Appendix D: Average Hourly Wages, Service Industries (Current Dollars)