Stretch Goals
Glossary Words from the following Reports: Fiscal Year, Gross Domestic Product, Net Ratio, Real GDP, Recession
Report: Real GDP Growth

Report: Net Debt to GDP Ratio

Summary Report
Importance
- Generating more GDP in New Brunswick will increase the province's tax base and allow for the provision of a higher standard of public services
- It will also generate more opportunities for employment and raise the incomes of New Brunswickers, allowing for higher levels of consumption
Problem
- New Brunswick has displayed lower GDP Growth Rates than other provinces and ranks among the lowest in GDP per capita
- This has many side effects including
- Persistent out migration of young people
- Higher reliance on federal transfers
- Lower level of provision of services by the province
- This has many side effects including
- Addressed under Debt to GDP Ratio.
Cause
- Slow GDP growth in the province as identified in the goals set by BoostNB is a result of many factors
BoostNB Growth Philosophy
GDP can be looked at from a regional growth perspective. Regional growth for the province of New Brunswick will involve a focus on the exports/base industries and the linkages they create. This can provide the groundwork for categorizing the BoostNB stretch goals for the province to work towards. Using this, categories; Growth, Base, Non-Base, Capture, and Non-Growth emerge. Below comprehensive descriptions of each will be outlined.
Growth Goals
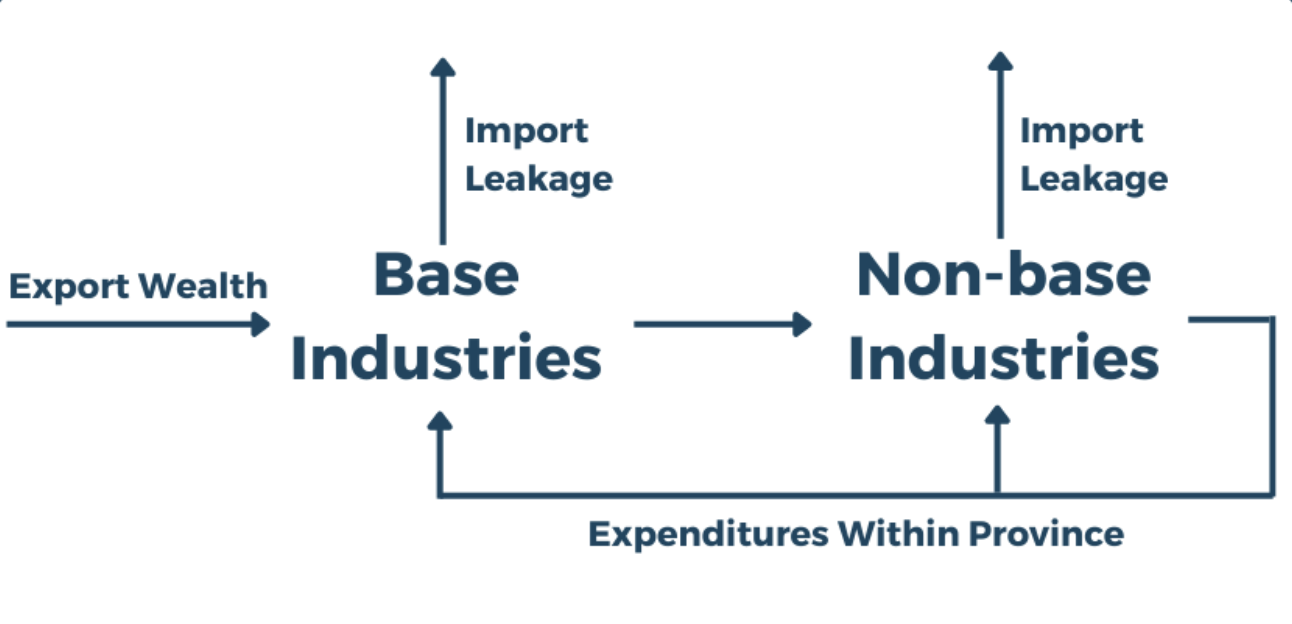
Regional growth can be attributed to industries that participate in exporting and capture exporting wealth. These industries are considered to make up the “base” of the New Brunswick economy, bringing in wealth that stimulates activity. This includes our natural resources and manufacturing primarily; these are industries with international markets and competition. These major exporters are best utilized by “capturing” as much of this wealth as possible through either creating supporting industries for these large exporters or enhancing the profitability of existing industries. This “capture” has the effect of keeping export wealth within the economy. In New Brunswick, most people are employed in the “non-base” industries that produce only for the local population such as restaurants and barbers. When the base industries grow, the non-base industries grow with them to support them. For this reason, to grow the economy New Brunswick must stimulate export growth by capturing their full potential. How each of our categories fits into this model is shown below.
- Growth: GDP, Population
- Base: Natural Resources, Trade
- Non-Base: Labour
- Capture: Investment
Figure 1: Flow Diagram
Non-Growth Goals
There is growing literature and debate surrounding whether growth should be the primary objective of developed economies. This is because past a certain threshold of wealth, happiness and health is no longer increased by even more wealth. Rather, to serve the happiness of the New Brunswick population and future generations it may be preferable to maintain such targets as Greenhouse Gas (GHG) Emissions or equality. Income equality is shown to have a profound effect on things such as happiness and many other key social indicators. For this reason, BoostNB has created “stretch goals” in the areas of GHG Emissions, Life Satisfaction, and Income Equality. These goals do not necessarily contribute to economic growth but instead, serve to build a stronger society.
- Non-Growth Goals: Social and Environmental Welfare
In the Numbers
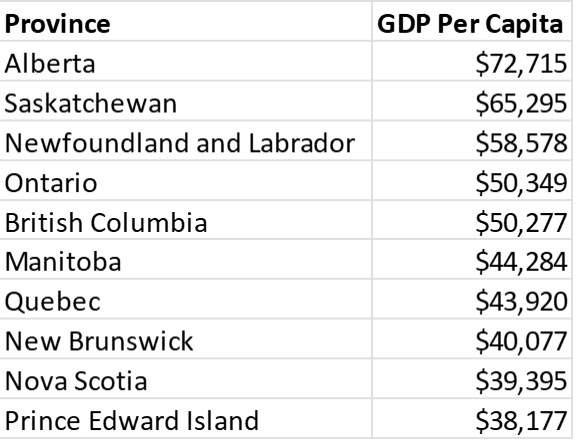
New Brunswick and the other Maritime provinces have the lowest GDP per capita of all provinces in Canada as shown in Figure 2. This means that the economic activity and production of New Brunswickers is lower than other provinces. In 2021, this number equalled $40,100 (2012 chained dollars). This list was topped by Canada’s oil and gas provinces, followed by its most urbanized provinces with the Maritime provinces occupying the last three places.
Figure 2: GDP Per Capita 2021 (2012 chained dollars)
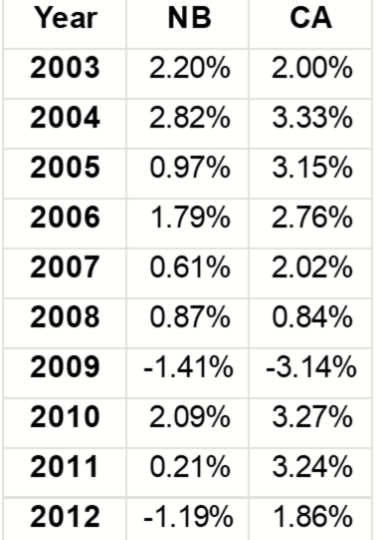
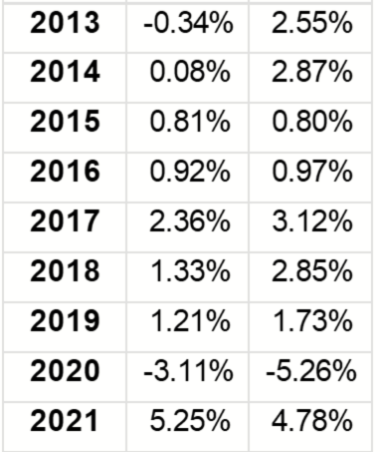
New Brunswick also typically has low annual GDP growth rates, shown in Figure 3 on a year-to-year basis. The tendency is that New Brunswick weathers global recissions, such as the 2008 financial crisis and the Covid-19 pandemic, slightly better than the national average but benefits much less during times of recovery and in boom periods. This overall leads to New Brunswick lagging the nation. More can be found on this in Real GDP Growth.
Figure 3: Real GDP Growth Rates
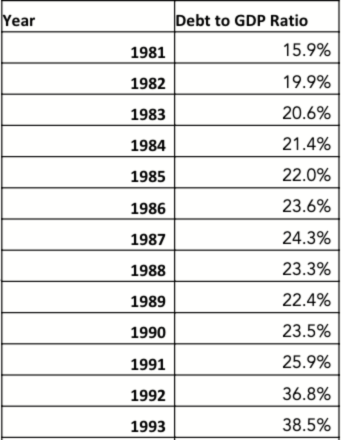
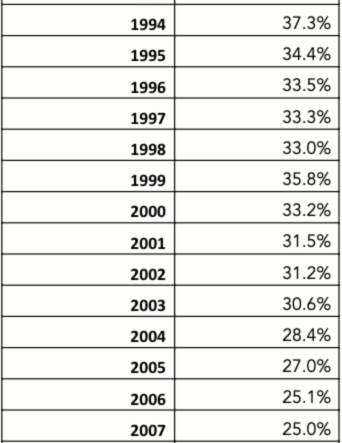
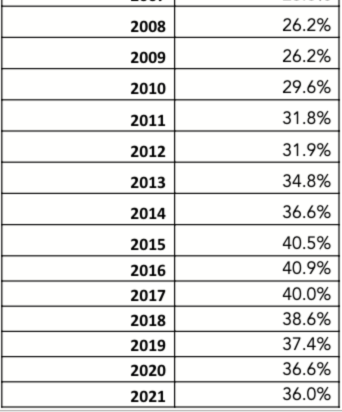
To show the weight that a lagging GDP or a growing debt is having on the economy we include a goal on the Net Debt to GDP Ratio.. The primary findings are displayed in Figure 4 showing that New Brunswick is not meeting the BoostNB goal of 30% debt to GDP ratio.
Figure 4: Debt to GDP Ratio
Summary
New Brunswick is not progressing at a satisfactory manner when it comes to achieving the goals relating to GDP growth. The reasons for this are on display throughout this website. To catch up to other provinces, New Brunswick will have to improve in several key areas. To see these key areas, it is useful to spend a few minutes exploring the BoostNB Dashboard for quick information on where New Brunswick is and is not performing well and where there is opportunity for change.
Appendix
Appendix A: GDP per Capita by Province
Source: Statistics Canada, Table 36-10-0402-01 (formerly CANSIM 379-0030) “Gross Domestic Product (GDP) at basic prices, by industry, provinces, and territories (x 1,000,000)”
Appendix B: Annual GDP Growth Rates
Source: Statistics Canada, Table 36-10-0402-01 (formerly CANSIM 379-0030) “Gross Domestic Product (GDP) at basic prices, by industry, provinces, and territories (x 1,000,000)”
Appendix C: New Brunswick's Net Debt-to-GDP Ratio
Source: Public Accounts of New Brunswick (For 2004-05: 2005 Budget). Contribution to/from Fiscal Stabilization Fund; Public Accounts of New Brunswick (for 2017-18: 2018 Budget)