Stretch Goal Reports
Glossary Words from the following Reports: Comprehensive Economic and Trade Agreement (CETA), Export, GDP, Import, social license
Report: Tourism Expansion

Report: Fisheries and Agriculture

Report: Mining in New Brunswick
Report: Forestry in New Brunswick

Summary Report
Importance
- Natural resources including Forestry, Fisheries & Agriculture, and Mining make up a significant portion of the New Brunswick GDP
- They employ many New Brunswickers in well-paying and stable jobs
- These sectors generate export wealth and pass it on to the surrounding communities
- They are an important focus for growth within the province
- New Brunswick hopes to expand its Tourism revenue in the coming years
Problem
- Since the early 2000s New Brunswick has been losing ground in mining and in forestry operations leading to a decline in revenue from these businesses
- From 2003-2007 NB lost many of its mills in the northeast which have not been meaningfully replaced
- The province has also missed on multiple mining opportunities in the past several years and consequently lost out on the growth that new opportunities would provide
- To grow, NB will have to develop its natural resources further or improve value-added processes. Fluctuations in commodity prices will also continue to have a major impact on these industries.
Cause
- In the last 20 years, a large portion of the New Brunswick population has rejected large-scale natural resource developments
- This has resulted in the closure of multiple mines, a shale gas moratorium in the province, and a lost appetite for an Energy East pipeline among others
- The environmental impacts of such developments are argued to be mismanaged
- The public will need to reach some level of consensus regarding the degree and what kinds of development to be permitted considering the trade-off between environmental factors and economic growth
- See BoostNB’s goals on Social and Environmental Welfare.
In The Numbers
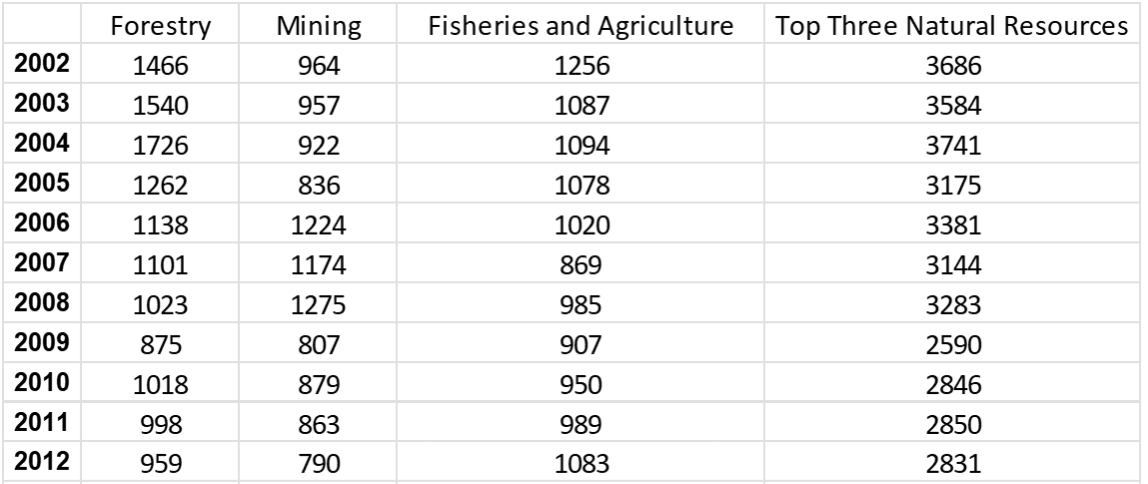
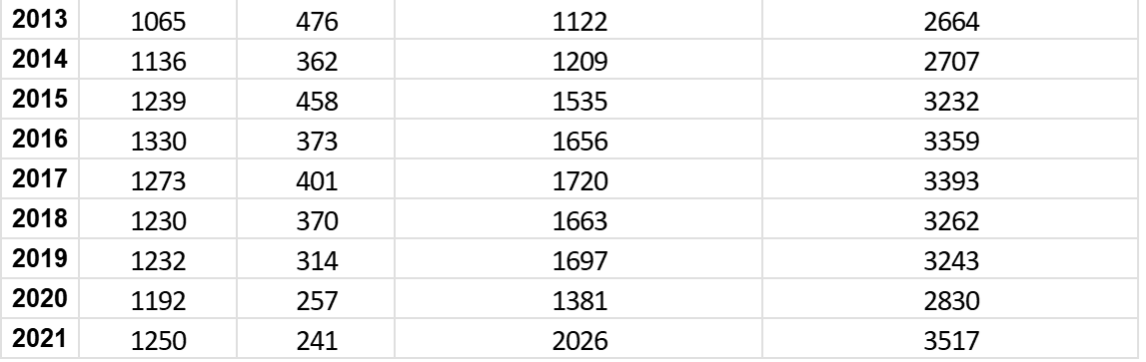
New Brunswick has been reliant on three natural resource industries to generate export revenue; Mining, Forestry, and Fisheries
& Agriculture. The sum of the three industries contribution to GDP is shown in Figure 1 using 2012 chained dollars. As is visible
on the graph, the GDP contribution of these three industries dropped from 2003 to 2009 reaching a minimum of $2.59B due to increased
competition and factors such as international competition and increased costs. Despite strong growth in the most recent year driven
primarily by fisheries and seafood packaging, the 2021 figure is still just shy of 2003 levels. New Brunswick has not expanded
its natural resource exports from the level seen two decades ago.
To put the following figures into perspective, note that the New Brunswick economy was about $31.6B GDP in 2021 (2012 Chained
Dollars) and the value of exports was about $25B pre pandemic (2012 Chained). International exports were about $14.7B of this in 2021.
A large part of these exports come from petroleum preparation at the Saint John refinery. This, however, is not considered a New Brunswick natural
resource because it is not extracted in New Brunswick, only refined, so instead this is considered a manufacturing export.
Figure 1: International Exports of Top Three Natural Resources (2012 chained dollars)
Figure 2 shows the individual contributions of each of the three significant natural resources (Mining, Forestry, Fisheries and Agriculture). We have not included data on hydro-electric power generation but this is known to have significant revenue as well, greater than that of mining. In 2009 each of the natural resources contributed roughly equal shares to the provincial GDP. Following 2009, international exports from mining continued to drop, likely due to the loss of social license and the closure of multiple mines. On the other hand, forestry has grown steadily following the drop from 2004 to 2009 and the closure of multiple mills. Growth within this resource is primarily due to increased efficiency and moving into more profitable products such as tissue paper and cardboard. The Fisheries and Agriculture sector has shown the greatest growth, primarily due to expansion of the Seafood Production and Packaging sector which makes up over 70% of the GDP in this category. A large part of this is due to very high lobster prices over these years.
Figure 2: International Exports by Natural Resource
A Closer Look
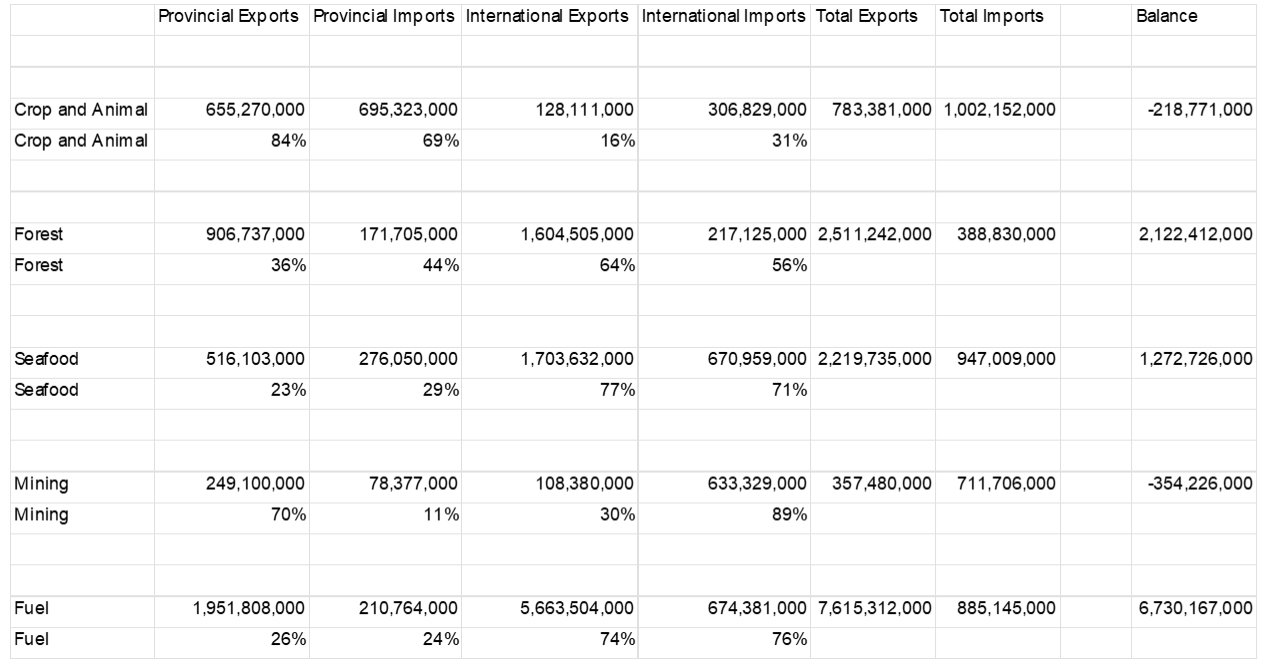
The charts and information above represent only international trade data. This is because information on interprovincial trade is less easily accessible and is lagged by a number of years. However, it is important to understand whether this omission of interprovincial trade data above has significant impact on our findings. Figure 3 shows all exports and imports both international and interprovincial for the year 2018. Despite the omission of interprovincial trade in Figure 2, it appears that international trade remains useful for measuring trends within industries and the New Brunswick economy.
Figure 3: All Trade, Natural Resources (2018)
Figure 3 tells a similar story to the previous. Forestry and Seafood products make up a bulk of the natural resource exports for the province, although when interprovincial exports are included for 2018, forestry is shown to be a larger exporter than Seafood. This is because a higher percentage of Forestry exports stay domestic than in the seafood sector. Data for 2021 is not available, but it is possible that seafood now makes up a larger portion of exports than forestry given the 2021 boom. Figure 4 shows that the largest industries tend to break into international markets in a larger way than smaller industries. For this reason, mining as well as Crop and Animal products rely heavily on domestic exporting while the largest natural resource industry, seafood, exports only 23% within the country.
Figure 4: Interprovincial Exports as a Percentage of Total Exports
Summary
In the past twenty years New Brunswickers have been more particular about the sorts of natural resource growth that they will allow in their province. For this reason, mining has taken a back seat to other resources. In the case of Fisheries and Agriculture a majority of the revenue in this area comes from the packaging and the preparation rather than the resource itself. Further, since 2009 growth in the Forestry sector has come primarily from increased efficiency in wood and paper product manufacturing and moving into more profitable products such as tissue paper. The conflicting forces of social license and improved processes have caused a decline in natural resource revenue from 2003 to 2009 followed by an increase from 2009 onward causing similar levels of natural resource output in 2021 as in 2003.
Appendix
Appendix A: International Trade by Top Three Natural Resources
Source: Trade Data Online
Appendix B: Total Trade by Natural Resource (2018)